1. Derived features
To define a derived feature in your EMF metamodel, you have set the following attributes of the feature:
-
derived = true (to indicate that the value of the feature is computed from the model)
-
changeable = false (to remove setter methods)
-
transient = true (to avoid persisting the value into file)
-
volatile = true (to remove the field declaration in the object)
VIATRA Query supports the definition of efficient, incrementally maintained, well-behaving derived features in EMF by using advanced model queries and incremental evaluation for calculating the value of derived features and providing automated code generation for integrating into existing applications.
The @QueryBasedFeature annotation can be used to mark a pattern as a derived feature realization. If the framework can find out the feature from the signature of the pattern (patter name, first paramter type, second paramter type), the annotation parameters can be empty.
Annotation parameters:
-
feature= "featureName" (default: pattern name) - indicates which derived feature is defined by the pattern -
source= "Src" (default: first parameter) - indicates which query parameter (using its name) is the source EObject, the inferred type of this parameter indicates which EClass generated code has to be modified -
target= "Trg" (default: second parameter) - indicates which query parameter (using its name) is the target of the derived feature -
kind= "single/many/counter/sum/iteration" (default:feature.isMany?many:single) - indicates what kind of calculation should be done on the query results to map them to derived feature values -
keepCache= "true/false" (default:true) - indicates whether a separate cache should be kept with the current value. Single and Many kind derived features can work without keeping an additional cache, as the RETE network already keeps a cache of the current values.
For example:
Extend our metamodel with following connectedTo reference of the State eClass and set the required properties.
@QueryBasedFeature
pattern connectedTo(state: State, other: State){
    State.outgoingTransitions(state, transition);
    Transition.targetState(transition, other);
} or {
    State.outgoingTransitions(other, transition);
    Transition.targetState(transition, state);
}
2. Metamodeling with UML profiles
2.1. Overview
In this tutorial a profile is created with a custom palette. They are added to the Papyrus UML environment.
2.2. Environment of the exercise
You need an Eclipse Modeling Tools version 4.5 with the following installed features:
| Plugin | Version | Updatesite |
|---|---|---|
Papyrus UML |
1.1.4 |
You can install it from Help > Install New Sotware.... Select the updatesite of Mars (http://download.eclipse.org/releases/mars) to Work with. Select Modeling > Papyrus UML and click Next → Next → Install. We use the Papyrus perspective through the exercise.
2.3. Create your first profile
We create a new profile in a project with some basic elements.
-
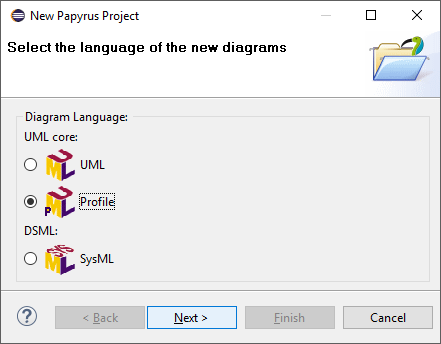
First we need to create a new project so right-click in the Project Explorer and select New > Papyrus Project and click Next.
-
At the first page of the wizard select Profile as Diagram Language.
-
At the next page set following properties and click Next:
Project name:
com.incquerylabs.course.cps.uml.profileModel file name:
cps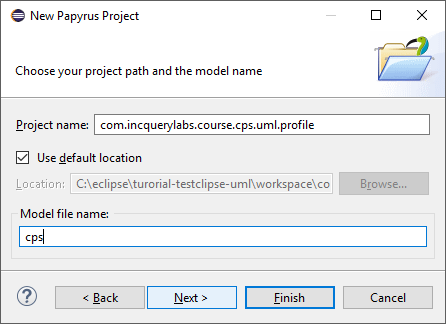
-
At the last page set Root model element name to
CyberPhysicalSystemand select the Profile Diagram diagram kind and click Finish.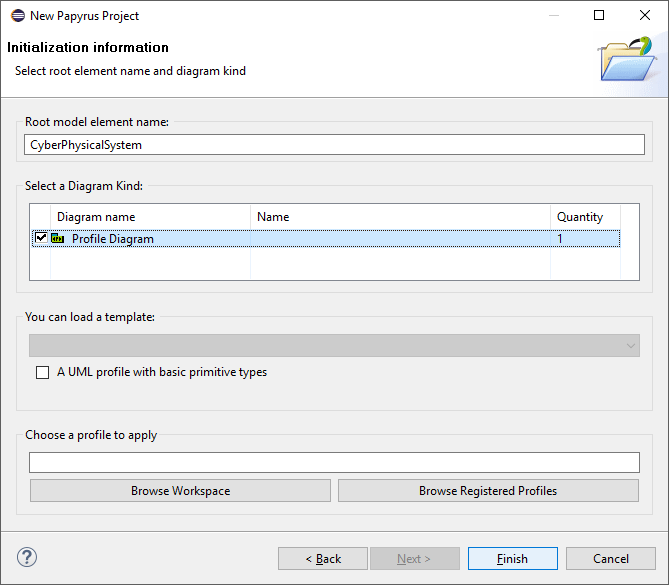
-
-
Then the
cps.profile.diis generated and opened in the editor. The profile diagram is empty yet.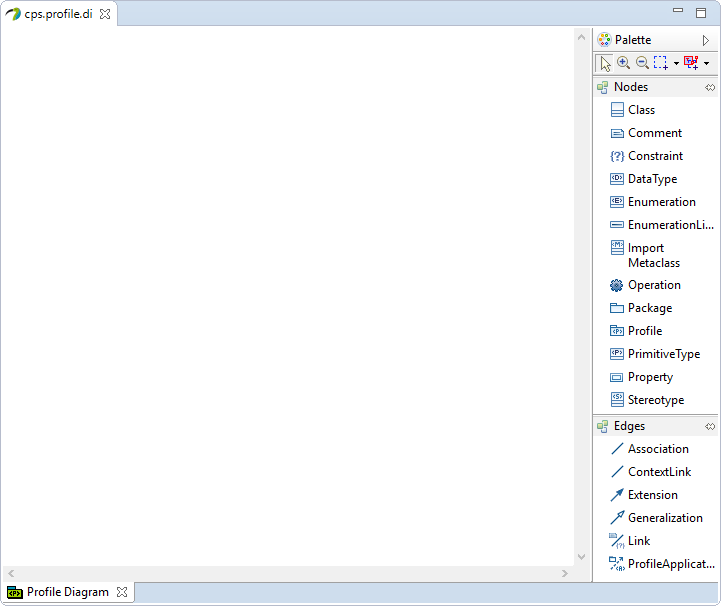
-
Now we create a new Stereotype from the Palette called
ApplicationInstance.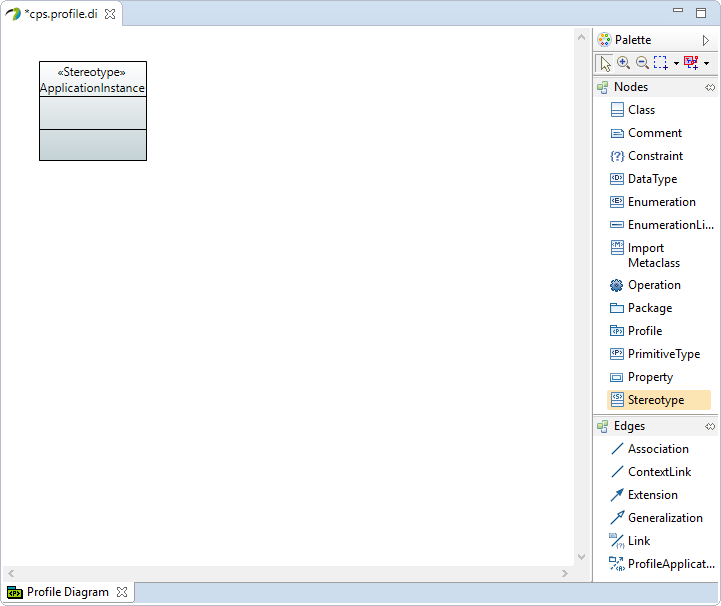
When saving, be careful with defining the profile: every definition will be generated into the uml file (see: generated definition of cps profile)! 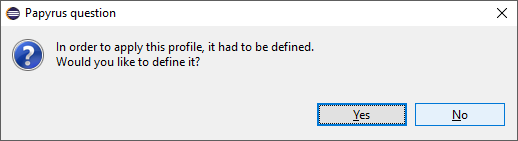
-
Next we create a new Import Metaclass and select
Artifactin the pop-up window.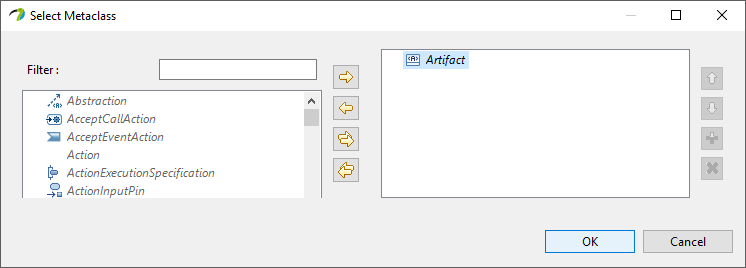
-
Create a new Extension between
ApplicationInstancestereotype andArtifactmetaclass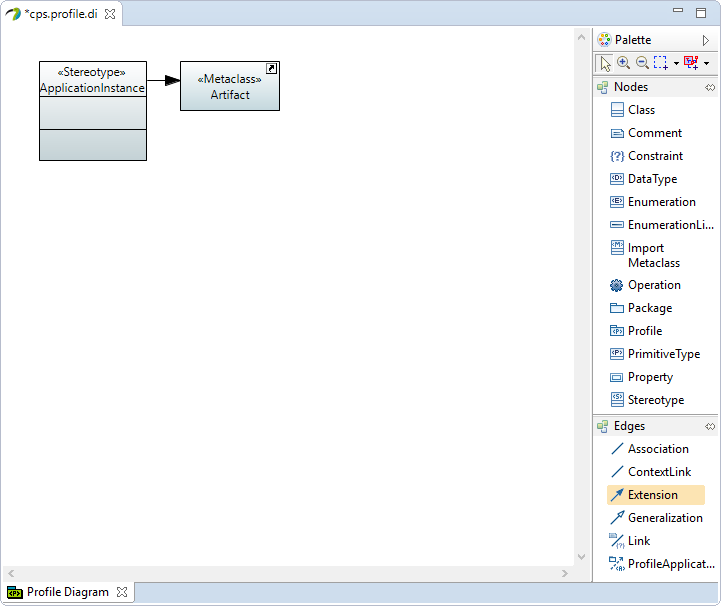
-
Create a new Property in
ApplicationInstancestereotype with following properties:Name:
dbUserType: UML Primitive Types > String
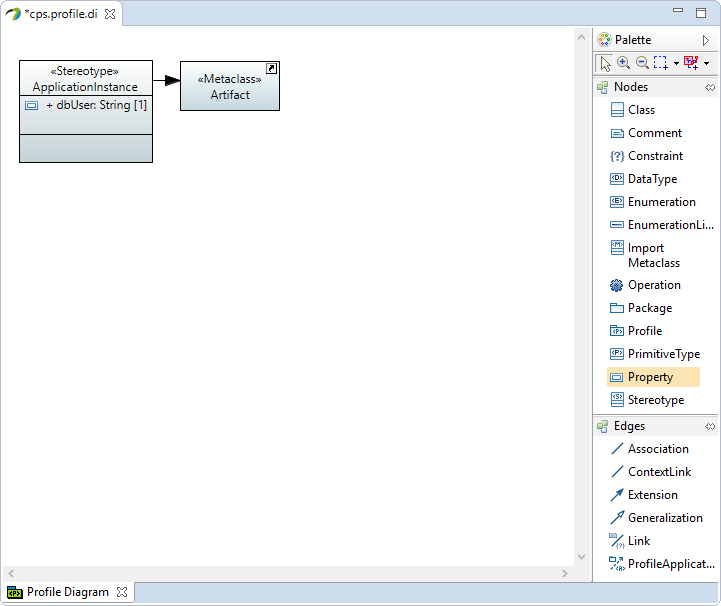
-
Under the stereotype’s Properties > UML, add Icon with following settings:
Kind: shape
Location:
platform:/plugin/org.eclipse.ant.ui/icons/full/elcl16/properties.png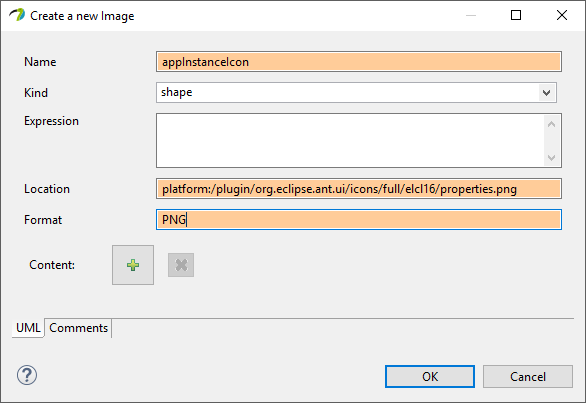
-
Now we can define the profile, so modify the diagram in an arbitrary way, then save and define it.
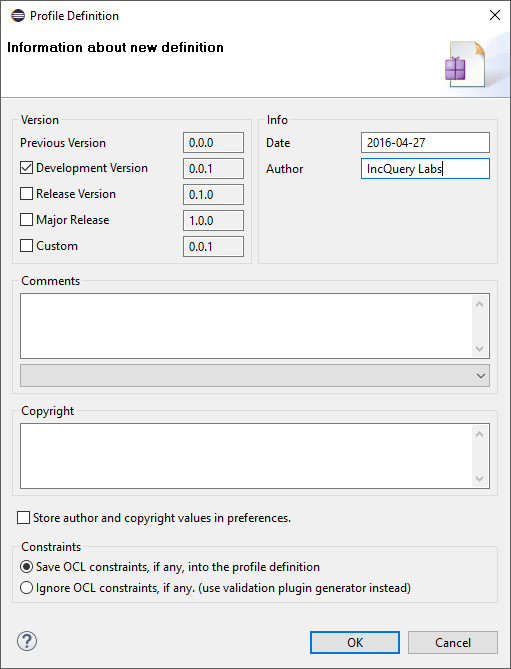
-
A definition will be generated into the
cps.profile.uml: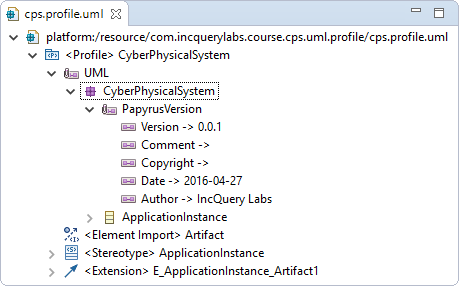 Figure 1. The generated definition in the
cps.profile.uml
2.4. Apply profile
At this section we try out the created profile.
-
First create a new Papyrus Project with the following settings:
Diagram Language: UML
Name:
com.incquerylabs.course.cps.uml.instanceModel file name:
cpsDiagram Kind: Deployment Diagram
Profile to apply: browse the newly created profile from the workspace
-
Then create a new Artifact
-
Under the artifact’s Properties > Profile add
ApplicationInstanceto Applied stereotypes.-
Expand
ApplicationInstancestereotype and set the value ofdbUserproperty.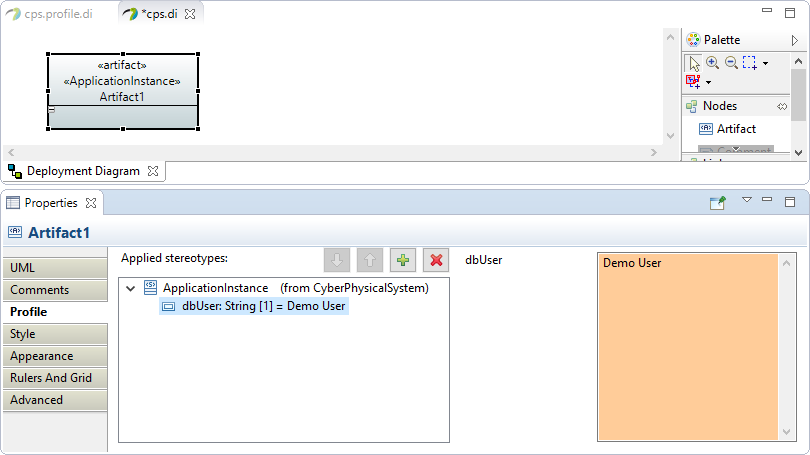
-
-
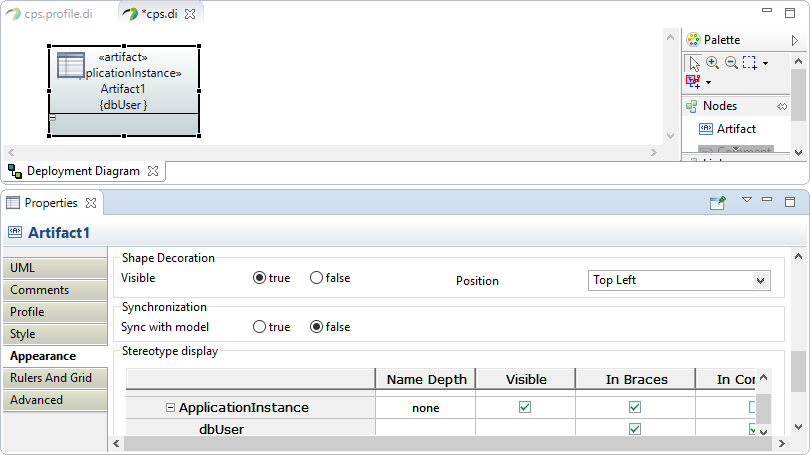
Under Properties > Appearance, set followings:
Shape Decoration > Visible: true
Stereotype display > ApplicationInstance: check In Braces
2.5. Register profile to Papyrus
Now we embed our profile in a plug-in and register it to Papyrus. After this we are able to use the profile like other built-in profiles in a runtime Eclipse
-
Right-click on the
com.incquerylabs.course.cps.uml.profileproject and select Configure > Convert to plug-in project. -
Open
MANIFEST.MF.-
First we define path mapping, so add new extension for extension point
org.eclipse.emf.ecore.uri_mapping. With this we connect a custom pathmap to the real path of something (in this case our project). Use following settings for mapping:-
source:
pathmap://CPS_PROFILE/ -
target:
platform:/plugin/com.incquerylabs.course.cps.uml.profile/
-
-
Then register the profile for Papyrus, so add a new extension for extension point
org.eclipse.papyrus.uml.extensionpoints.UMLProfile. If you do not find it then uncheck Show only extension points for required dependencies (this is because of the missingorg.eclipse.papyrus.uml.extensionpointsdependency, you need to add it). Use following settings for the profile:-
name:
CyberPhysicalSystem(arbitrary) -
path:
pathmap://CPS_PROFILE/cps.profile.uml(path to UML model file with pathmap)
-
-
2.6. Usage of the registered profile
Now we try out the registered CyberPhysicalSystem profile.
-
Launch a new runtime Eclipse by right-clicking on the project of profile and select Run As > Eclipse Application.
-
Create a new Papyrus Project in the runtime Eclipse, select UML to the Diagram Language and Browse Registered Profiles should contain registered
CyberPhysicalSystemprofile.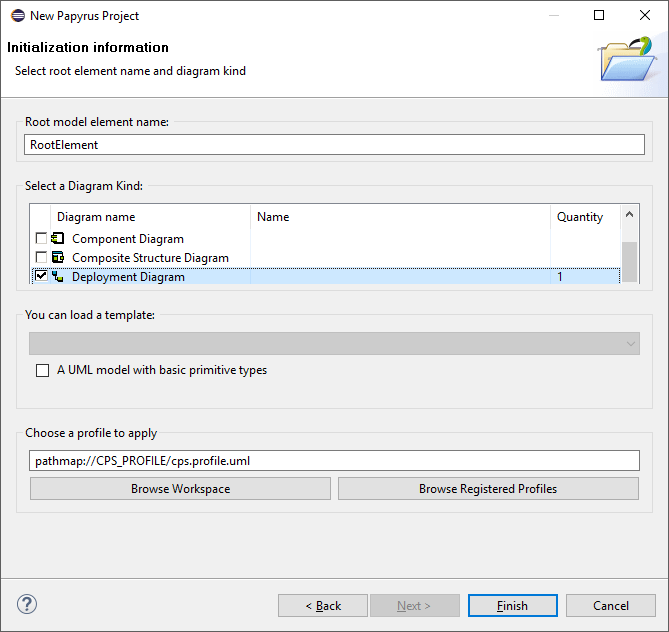
2.7. Customize palette
The last thing - what we create - is a custom palette for CPS profile.
-
Right-click on any content of the Palette of the
cps.diand select Customize.... -
In the pop-up dialog click on the button
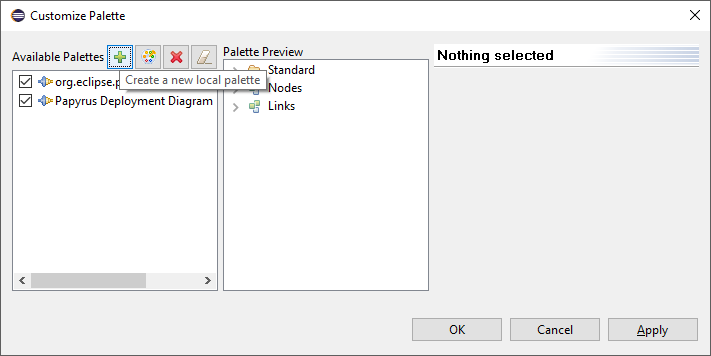
-
Set Name to
CPS palette, take note of Advanced > EditorID (it should beorg.eclipse.papyrus.uml.diagram.deployment) and click Next.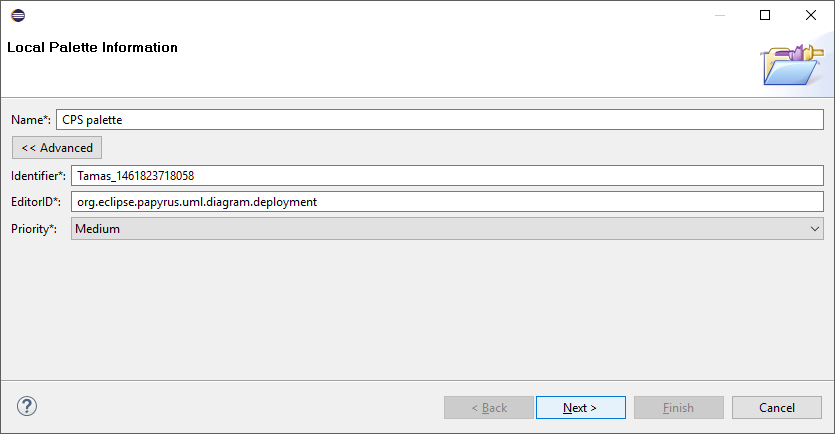
-
At the last page for Available Tools select CyberPhysicalSystem profile then add ApplicationInstance (Artifact) to the Palette Preview:
-
Click on ApplicationInstance (Artifact), click on the target in the Palette Preview then click on the button,
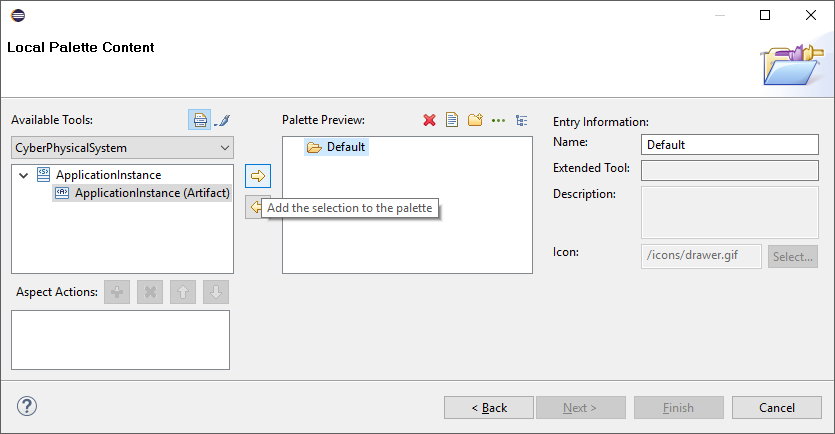
-
Or drag and drop the Application Instance (Artifact) to the Palette Preview.
-
-
Then click Finish
2.8. Register the new palette
-
Create a new Plug-in Project with following settings:
Name: com.incquerylabs.course.cps.uml.profile.customization
Generate an activator, a Java class that controls the plug-in’s life cycle: (unchecked)
-
Copy palette definition XML from
$WORKSPACE/.metadata/.plugins/org.eclipse.papyrus.uml.diagram.commonto$WORKSPACE/com.incquerylabs.course.cps.uml.profile.customization/palettes -
Open MANIFEST.MF
-
Add dependencies:
org.eclipse.papyrus.uml.diagram.commoncom.incquerylabs.course.cps.uml.profile -
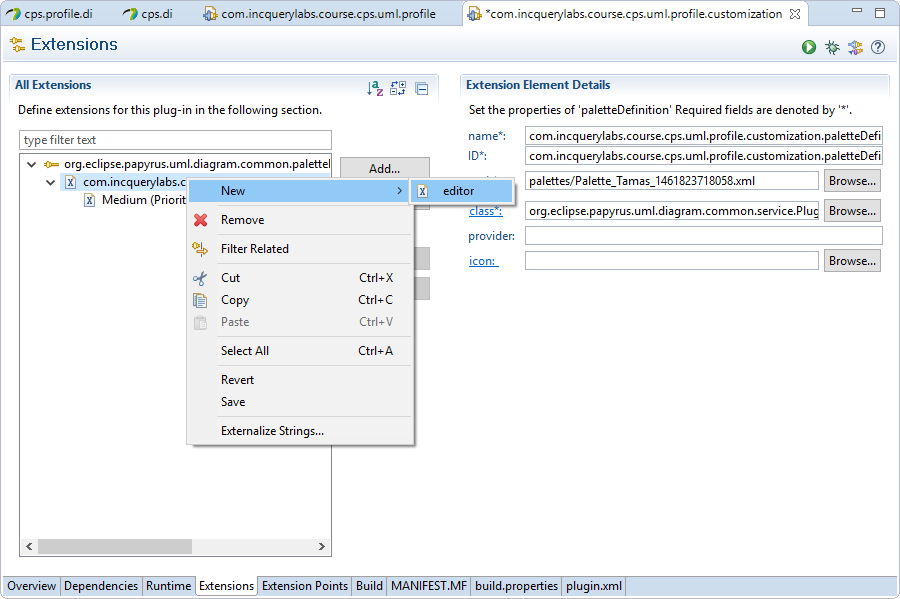
Add extension for extension point
org.eclipse.papyrus.uml.diagram.common.paletteDefinitionand set followings:Path: browse the palette definition XML
Class: org.eclipse.papyrus.uml.diagram.common.service.PluginPaletteProvider
Priority: Medium
-
Then right-click on the palette definition and select New > editor
-
Set the Id od the editor to the saved EditorID (
org.eclipse.papyrus.uml.diagram.deployment)
-
-
-
2.9. Usage of the palette
-
Launch a runtime Eclipse.
-
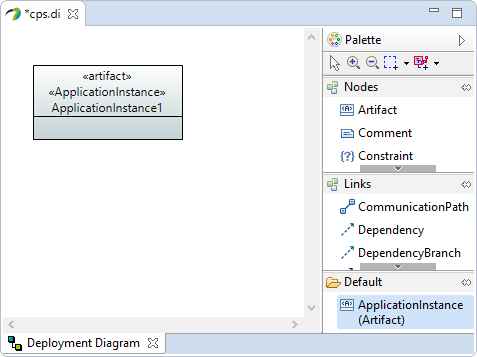
Open the previously created
cps.di(if you do not have this follow instructions of this section). -
The palette will be in the editor:
3. Querying & transforming UML profile applications
-
Create static profile
-
Open profile
-
Under Properties > Profile, add Applied stereotype EPackage
-
packageName =
profile -
nsURI =
http://Papyrus/CpsProfile -
basePackage =
com.incquerylabs.course.cps.uml -
prefix =
CpsProfile
-
-
New > EMF Generator Model
-
Model importer: UML model
-
Model URI: browse profile UML from workspace
-
Ignore warnings
-
Root packages:
-
Package:
com.incquerylabs.course.cps.uml.profile -
File Name:
cps.profile.ecore
-
-
Referenced generator models: all
-
-
In the opened genmodel, right click root element > Generate Model Code
-
Open the UML model file with text editor
-
Take note of Profile’s xmi:id
-
-
Open MANIFEST.MF
-
Add dependencies:
-
org.eclipse.emf.ecore
-
org.eclipse.uml2.uml
-
-
Add extension for point org.eclipse.uml2.uml.generated_package
-
Uri:
http://Papyrus/CpsProfile(nsURI of EPackage) -
Location:
pathmap://CPS_PROFILE/cps.profile.uml#+ Profile’s xmi:id
-
-
-
-
Use profile from VIATRA
-
Run new Eclipse Application
-
Import the lab projects
com.incquerylabs.course.cps.uml.viatra.batch* -
Run
ApplicationTypeMappingTestas JUnit Plug-in Test -
Run new Eclipse Application
-
Import the
com.incquerylabs.course.cps.uml.viatra.instanceproject (this contains the UML model file containing the profile application) -
Right-click it and select Transform to CPS
-
-
-
4. VIATRA Debugger
4.1. Debugging model transformations
The development and debugging of model transformations is not a trivial exercise, the basic concepts of software debugging however can be mapped to this field as well. Debuggers can be used for detecting bugs, as well as better understanding the structure and behavior of programs. Direct control over a program allows the programmer to follow the flow of execution or stop the program at any desired point. Then it is possible to inspect its current state and verify the correctness of the software. These properties are very desirable in the field of model transformations too. The VIATRA framework incorporates a debugger framework that supports the following features:
-
Display the state of remote VIATRA transformations.
-
Allow the user to control the execution of VIATRA transformations, via standard debugger commands ("Step over", "Continue") or by selecting the next activation to be executed.
-
Display the model instances associated with the transformation under debugging.
-
Allow the user to define various transformation breakpoints.
4.2. Architectural Overview
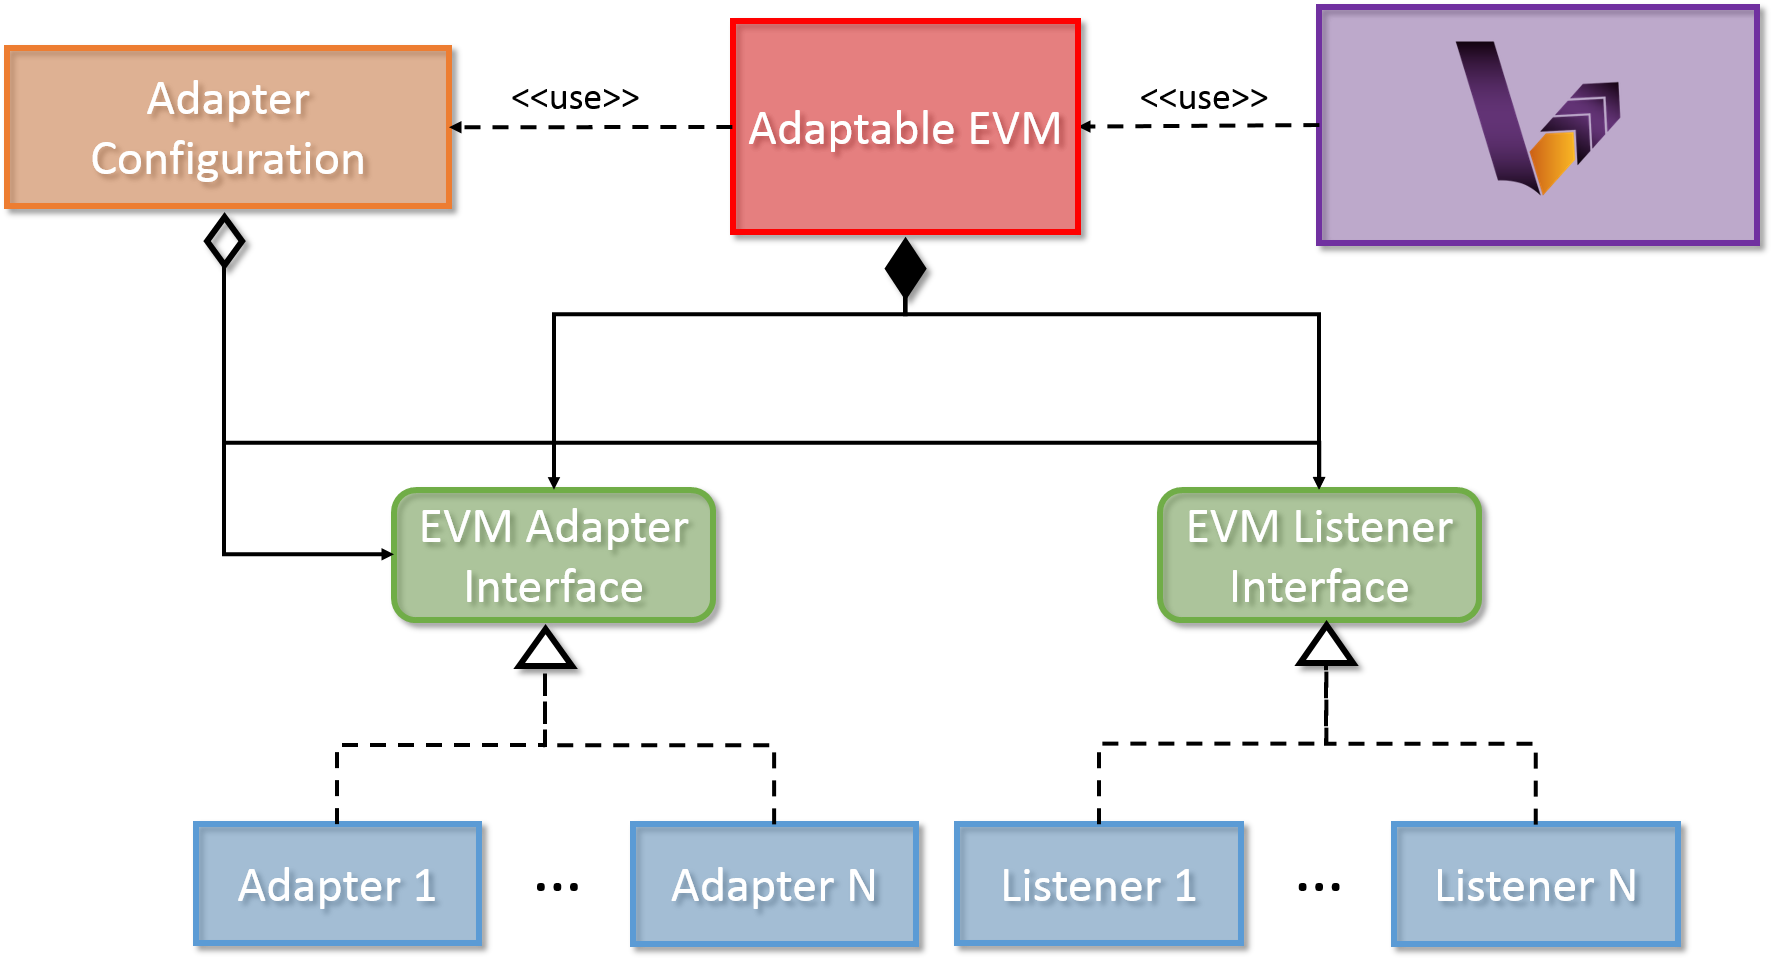
A full-fledged transformation debugger requires a software solution that is able to observe and control model transformations. The debugger should be able to insert additional functionality into certain points during the execution of model transformations. The VIATRA Adapter Framework allows the definition of additional functionalities that are executed at certain points in VIATRA-based model transformations. The previously described debug functionalities are implemented using the VIATRA Adapter Framework.
-
Adapter Interface: The Adapter Interface defines a set of callback methods that are executed at certain points during the transformation execution. These actions are capable of altering the execution sequence of transformation rules. A number of Adapters can implement this interface, in order to define additional functionality that should be undertaken at certain points in the transformation.
-
Listener Interface: The Listener Interface defines a set of callback methods that are executed at certain points during the transformation execution. The actions defined in these methods can have no effect on the transformation itself, purely aim at providing a solution to listening to certain transformation-related events. A number of Adapters can implement this interface, in order to define additional functionality that should be undertaken at certain points in the transformation.
-
Adaptable EVM: The Adaptable EVM is responsible aggregating the used Adapter and Listener instances and delegates the callback method calls from the internal VIATRA objects towards the appropriate callback method of each adapter or listener at certain points during execution. The Adaptable EVM is also responsible for setting up VIATRA transformation to utilize adapters.
-
Adapter Configuration: The adapter configurations serve multiple purposes. They can either define dependency relations between adapter implementations, or specify complex use cases which requires more than one adapter to function properly
The Adapter Framework provides a generic, easy-to-use technique for creating user defined adapter and listener implementations. The Adapter Framework is utilized in order to implement a set of debugging-related use cases.
4.2.1. VIATRA Transformation Debugger
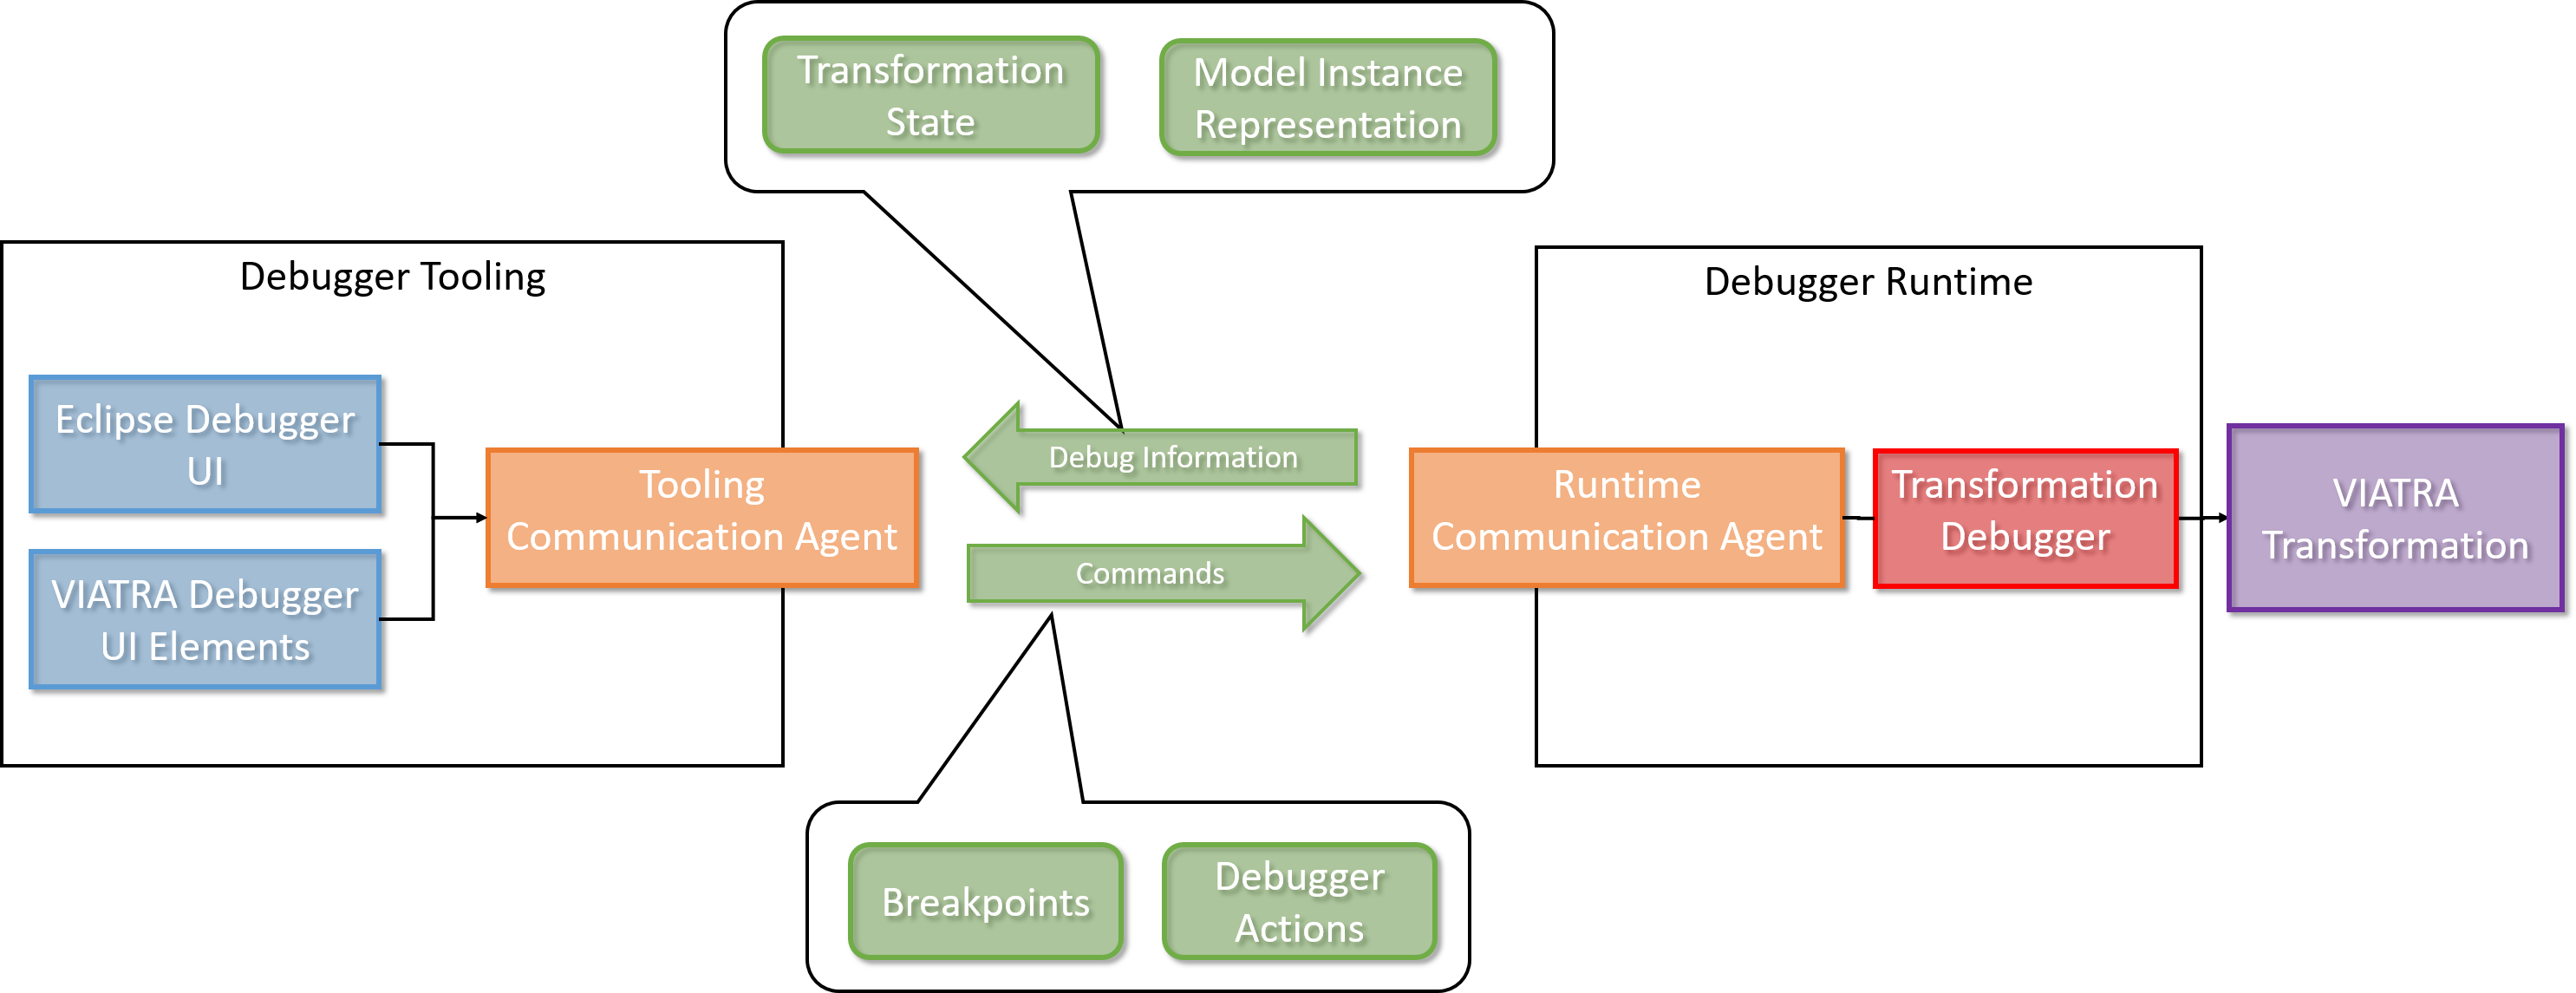
The VIATRA transformation debugger implements a breakpoint based debugging approach (similar to JDT). It utilizes the Eclipse Debug framework, as well as some custom debug-related views. It contains the logic for stopping the transformation execution if a breakpoint condition matches, and updating the Transformation Debug Model, based on which the current transformation state is displayed. To support various debugging use cases, the debugger supports various breakpoint implementations as well. The debugger consists of two main components:
-
VIATRA Debugger Runtime: It contains the debugger elements associated with the running model transformation instance. These elements are responsible for instrumenting the transformation instance and propagating the gathered information to the tooling elements. They also enable the tooling elements to control the instrumented transformation instance.
-
VIATRA Debugger Tooling: It contains elements associated with extending the Eclipse Debug Framework. They allow the information provided by the runtime elements to be displayed on the Eclipse debug UI, and enable the user to control the transformation under debugging.
-
Debugger Runtime
-
Transformation Debugger: Observes and manipulates the execution of a VIATRA transformation.
-
Runtime Communication Agent: Responsible for orchestrating the communication between the tooling and runtime components. Uses JMX-based communication.
-
Debug Information: Data that is propagated between the runtime and tooling components. I contains information about the state of the transformation under debugging, and the involved model instances as well. This information is displayed by debugger tooling components.
-
Transformation State: It contains information about the transformation under debugging. Including the state of the transformation conflict set and the next activation to be executed.
-
Model Instance Representation: Represents model instances that are associated with the transformation, using a generic, serializable meta-model.
-
-
Debug Actions: User actions that are sent from the tooling to the runtime components.
-
Breakpoints: The debugger framework supports a set of different transformation breakpoints.
-
Rule Activation Breakpoints: Identifies a transformation rule activation. If the given activation is about to be fired, the transformation execution will be halted.
-
Conditional Breakpoints: These breakpoints are able to define global constraints that are not only affected by the current activation. A similar concept is available in the Eclipse Java Development Tools (JDT). The constraints are defined by using the VIATRA query language.
-
Rule Breakpoints: These breakpoints identify a given VIATRA transformation rule. The execution is halted if an activation of this rule is about to be fired.
-
-
Debugger Commands: User commands that are sent from the tooling components to the runtime components.
-
-
-
Debugger Tooling
-
VIATRA Debugger UI Elements: UI elements that display transformation-specific information that cannot be visualizes via using Eclipse debug UI elements.
-
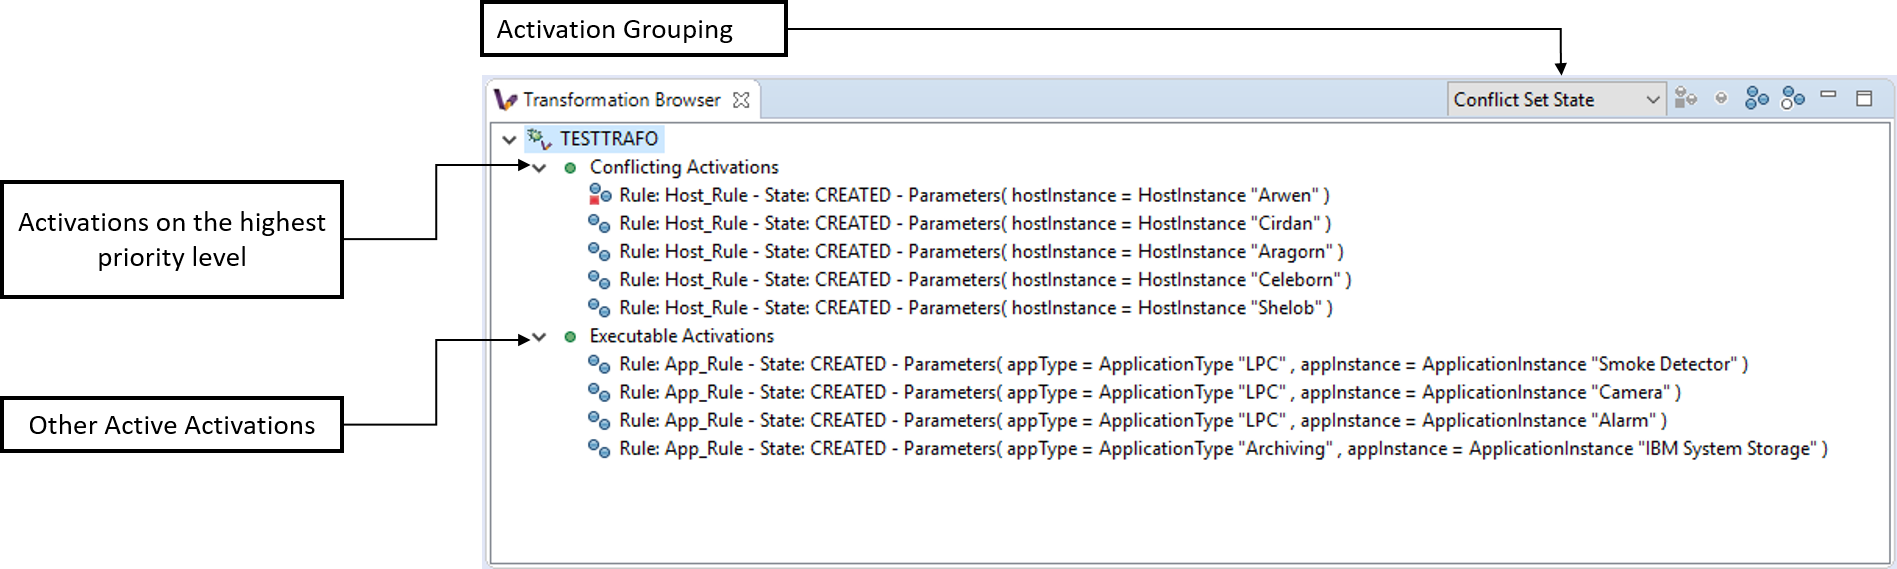
VIATRA Transformation Browser: Displays the current state of the model transformation. Shows the set of activations to be fired, and allows the user to control the execution of the transformation or define breakpoints as well. The activations displayed can either be grouped by their parent rule, or their position in the transformation conflict set.
-
VIATRA Transformation Model Instance Viewer: Displays the current state of the model instances related to the transformation using a tree-view with properties support.
-
-
Eclipse Debugger UI Elements: Eclipse debugger UI elements that display transformation debugger-related information.
-
4.3. User’s Guide
The following section aims at providing a basic example of how the VIATRA transformation debugger should be used. The example utilizes the following VIATRA example projects:
-
VIATRA CPS Example: The debugger example is based on the CPS meta-models, and utility features.
-
VIATRA Transformation Debugger example: Provides the example model transformations, and UI components responsible for running them.
4.3.1. Setting Up the Transformation Under Debugging
In order to support debugging, the model transformation definition needs minor modifications. These can be done in two different ways:
-
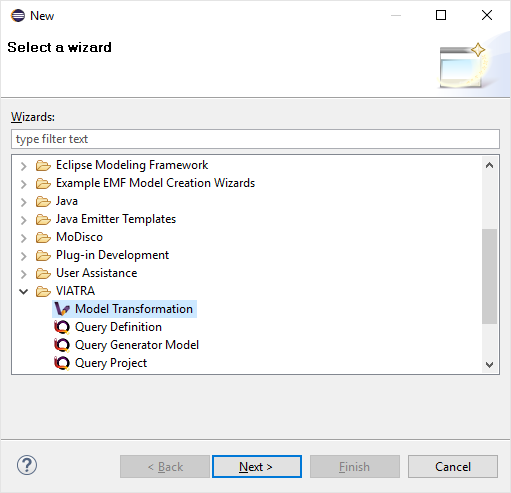
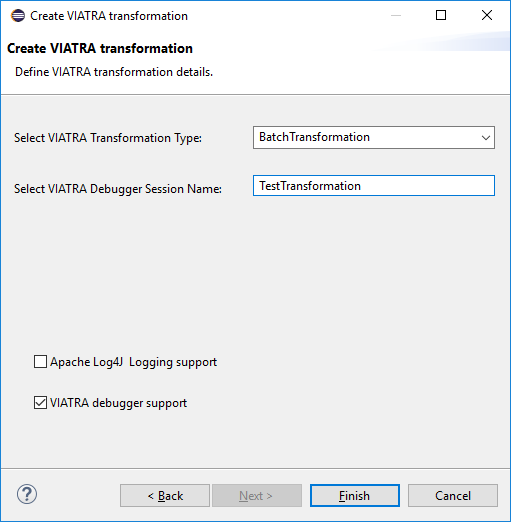
If the transformation is being newly developed, it is highly advised to use the VIATRA model transformation creation wizard. As shown on the figure below, the user can select the "VIATRA debugger support" checkbox, this way the generated code will incorporate the appropriate setup.
| Use the VIATRA Debugger Session Name optional parameter to define a textual identifier for the transformation. Usage of this identifier helps the transformation developer to differentiate between different model transformation sessions, while using the transformation debugger. |
-
In case of an already-existing transformation, the model transformation definition needs to be modified manually. This involves adding the VIATRA debug configuration to the VIATRA transformation builder. The following example snippet shows how this is achieved in the example.
private def createTransformation() {
    import org.eclipse.viatra.transformation.debug.configuration.TransformationDebuggerConfiguration
    ...
    transformation = BatchTransformation.forEngine(engine).addAdapterConfiguration(new TransformationDebuggerConfiguration("TestTransformation")).build
    ...
}
As the VIATRA transformation debugger is a Remote Debugging-style debugger, the example transformation needs to be started manually. This is especially true in case of batch transformations, since event-driven transformations typically run continuously. The example uses a simple command and handler to run the model transformation on a predefined test model.
public class BatchTestHandler extends AbstractHandler {
    @Override
    public Object execute(ExecutionEvent event) throws ExecutionException {
        final Job job = new Job(JOB_NAME) {
            protected IStatus run(IProgressMonitor monitor) {
                // Load the CPS model
                CPSModelInitializer init = new CPSModelInitializer();
                CPSToDeployment cps2dep = init.loadModel(SOURCE_MODEL_URI);
                // Initialize CPS to Deployment Transformation
                CPSTransformation transformation = new CPSBatchTransformation(cps2dep);
                // Execute the transformation and observe the effects of the selected adapter
                transformation.execute();
                transformation.dispose();
                return Status.OK_STATUS;
            }
        };
        job.schedule();
        return null;
    }
}
In order to properly initiate the VIATRA debugger runtime agent, the target Eclipse instance should be launched via using the following command line arguments:
-Dcom.sun.management.jmxremote.port="port to be used, typically 1099"
-Dcom.sun.management.jmxremote.authenticate=false
-Dcom.sun.management.jmxremote.ssl=false
4.3.2. Using the Debugger UI
The following section describes how to use the VIATRA transformation debugger UI elements once the debugging infrastructure is set up. This section of the guide assumes that a target Eclipse instance is running.
4.3.2.1. Connecting to the transformation under debugging
-
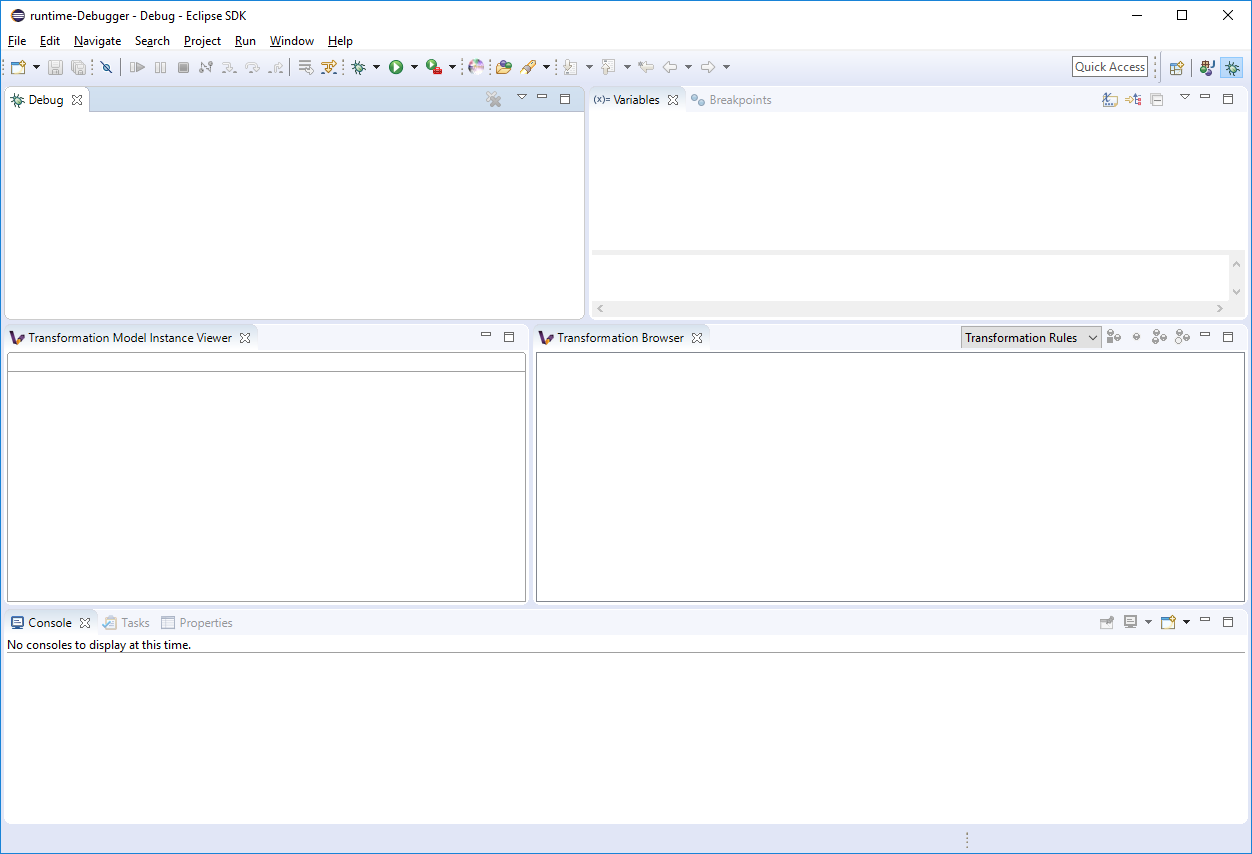
If the VIATRA debugger feature is installed, the Debugger UI Elements are contained by the Eclipse Debug perspective, once this perspective is selected, the related VIATRA debug views are displayed.
-
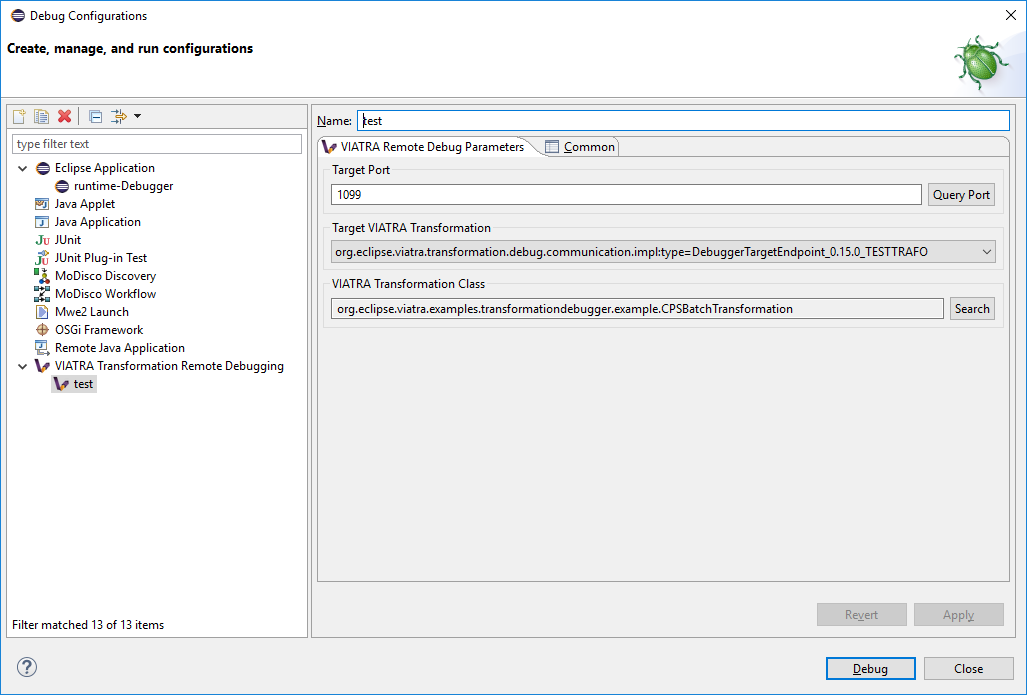
The debugger can be initialized via launching a VIATRA Transformation Remote Debugging debug configuration. The debug configuration can be specified similarly to any other Eclipse launch configuration. As the figure below shows, firstly, the target port needs to be specified. This value needs to be equal to the port value specified in the target Eclipse launch configuration (typically its 1099).
-
Next the port needs to be queried, via using the button located next to the port text field.
-
After the querying is completed, the user can select from a set of transformation instances that are present on that port.
-
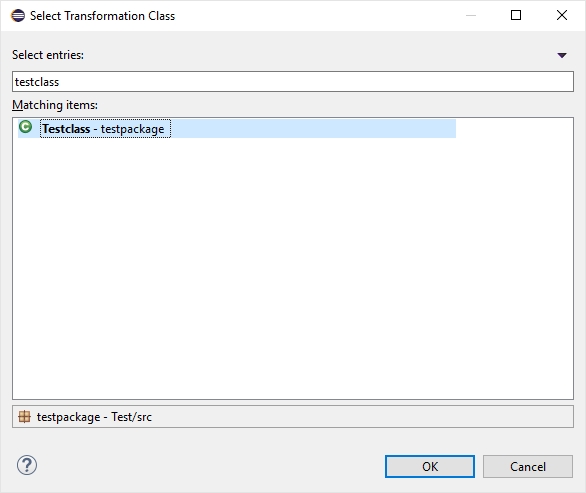
Finally, a class file present in the workspace needs to be selected, as the breakpoints associated with the transformation will be bound to the resource of this file.
-
These launch configurations are saved, once the user defines a configuration for a target transformation, it can be reused without any required modifications (Assuming that the user did not modify the ID of the transformation session).
-
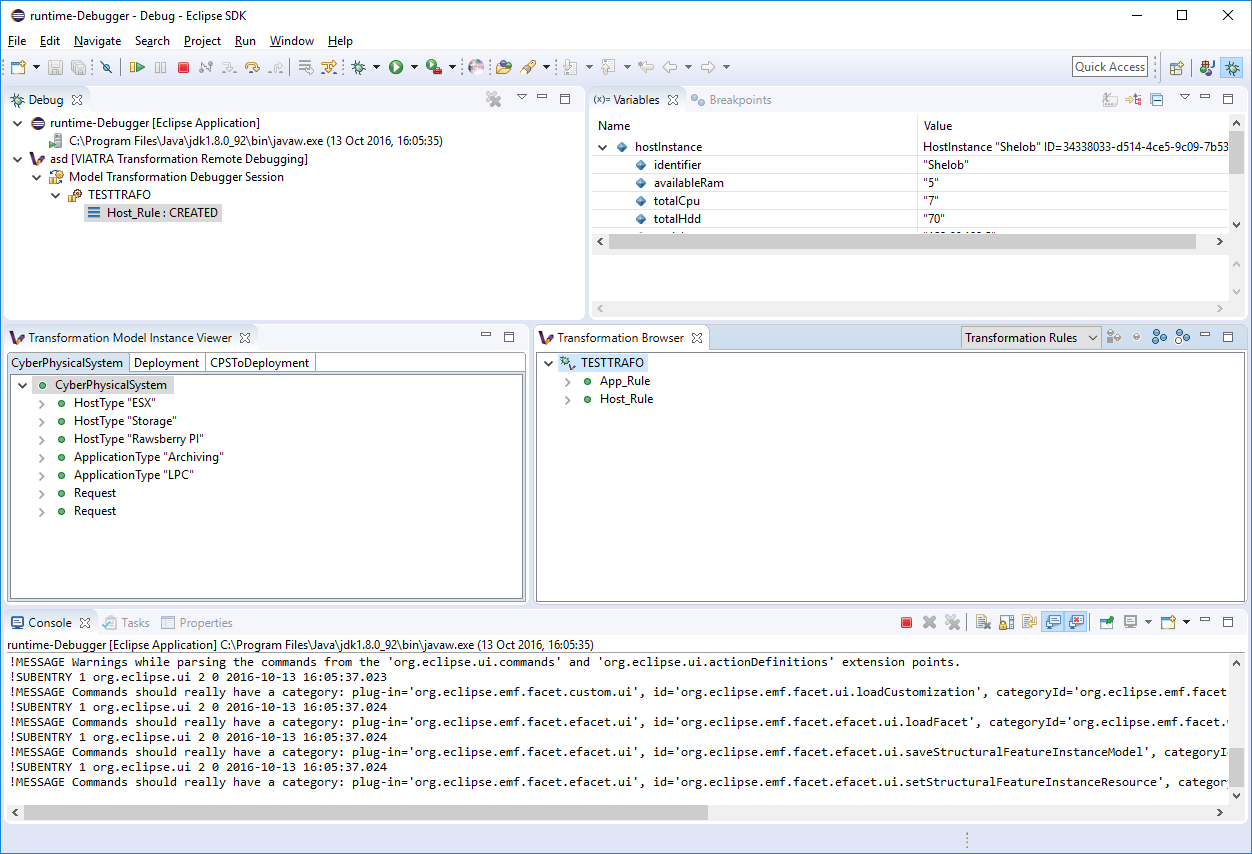
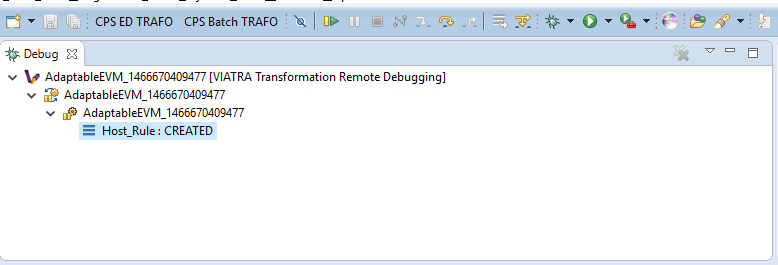
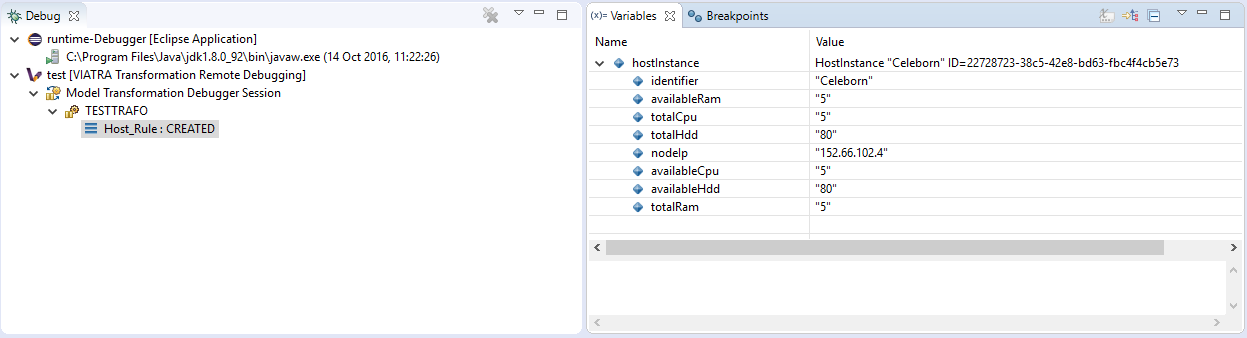
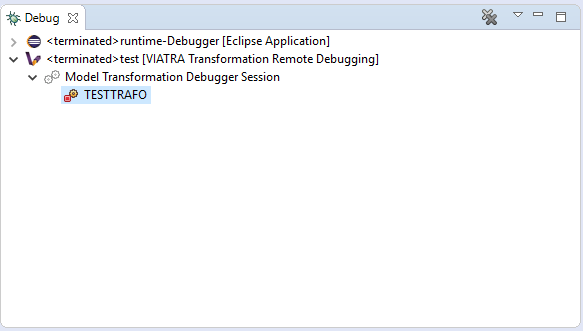
After launching the debug configuration, the debug session is initialized allowing the user to observe and control the execution of the selected transformation. Here the transformation debugging session is displayed in the Eclipse debug view. There are however additional contemporary views that display the details of the selected debug session.
4.3.2.2. Browsing the transformation state
One of the main use-cases of the VIATRA transformation debugger, is to enable the transformation developer to observe the state of a VIATRA transformation at certain point in its execution sequence. The debugger allows the transformation developer to observe the following transformation elements:
-
Active transformation rule activations
-
Input and output model instances
-
The input parameters of the next Activation
| In order to use the debugger UI elements, select the Debug Stack trace representing the transformation: |
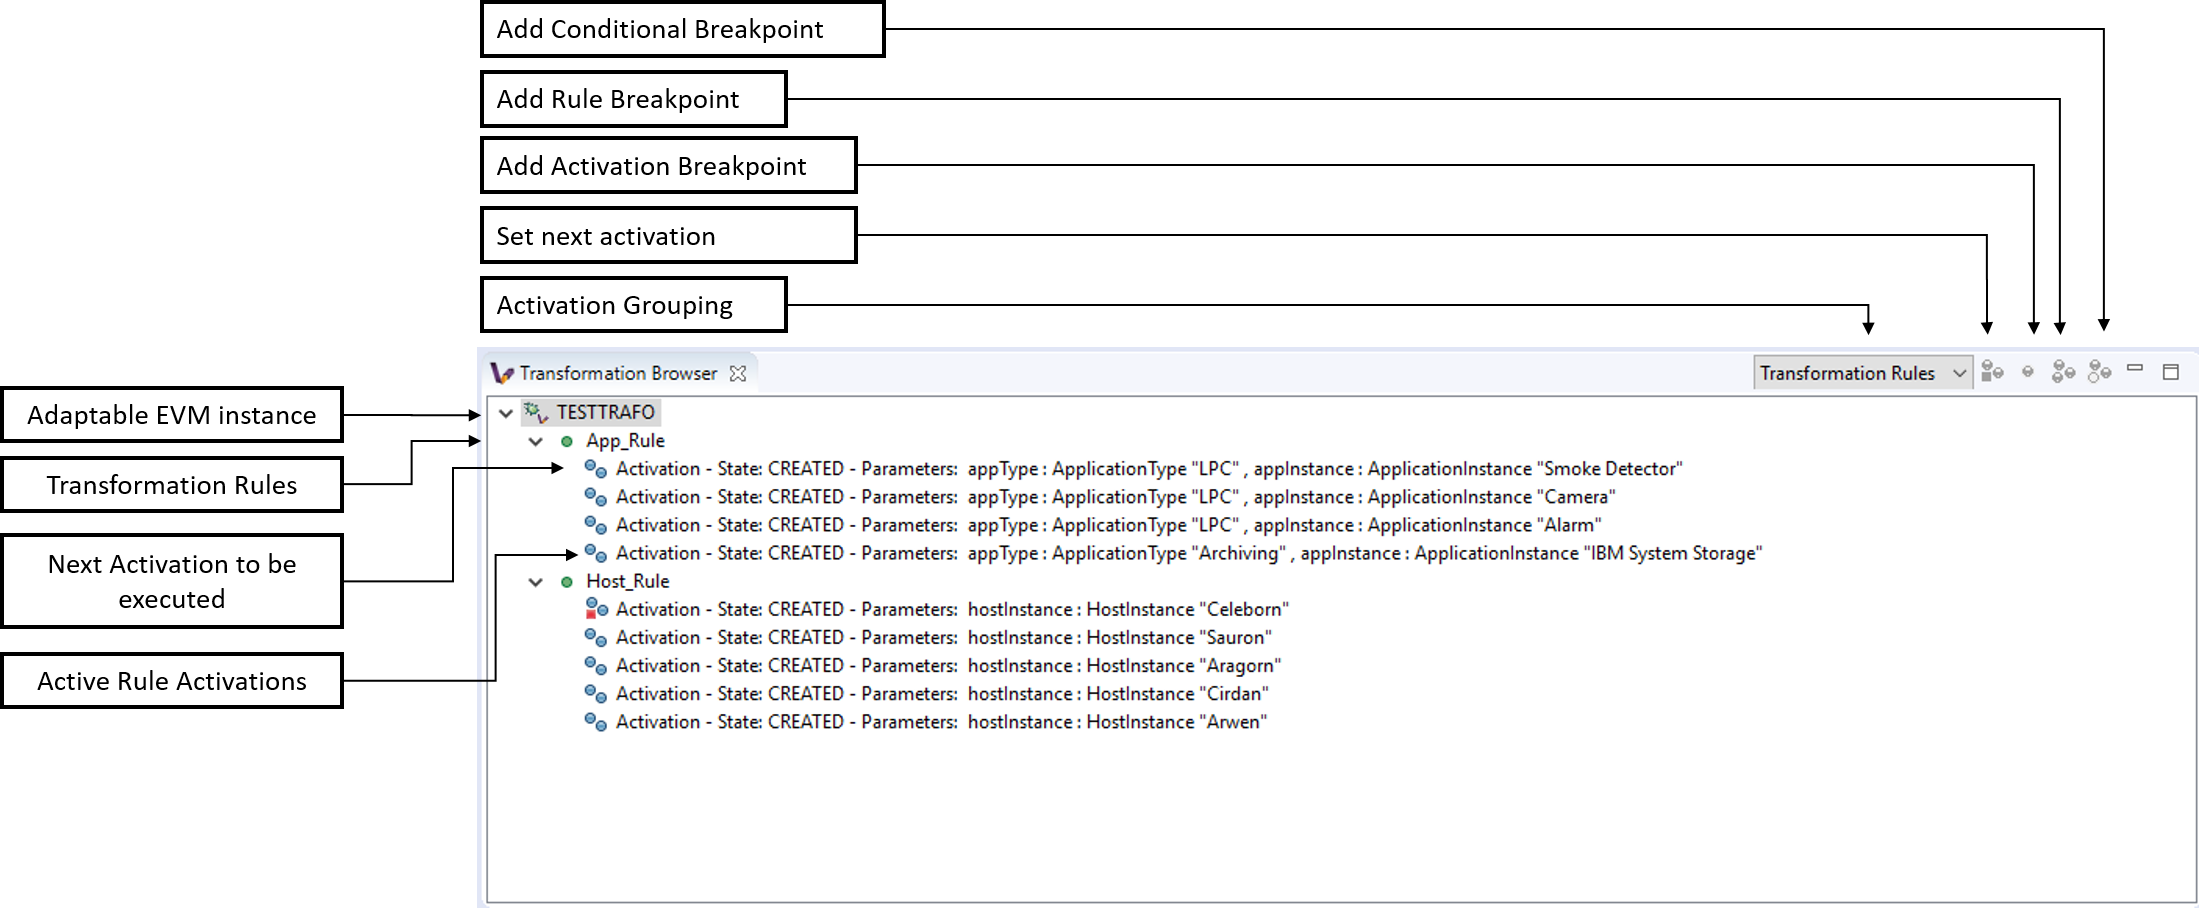
The Transformation Browser view is responsible for observing the internal state of the transformation. It allows the user to observe the current transformation rule activations, and it supports the definition of various transformation breakpoints.
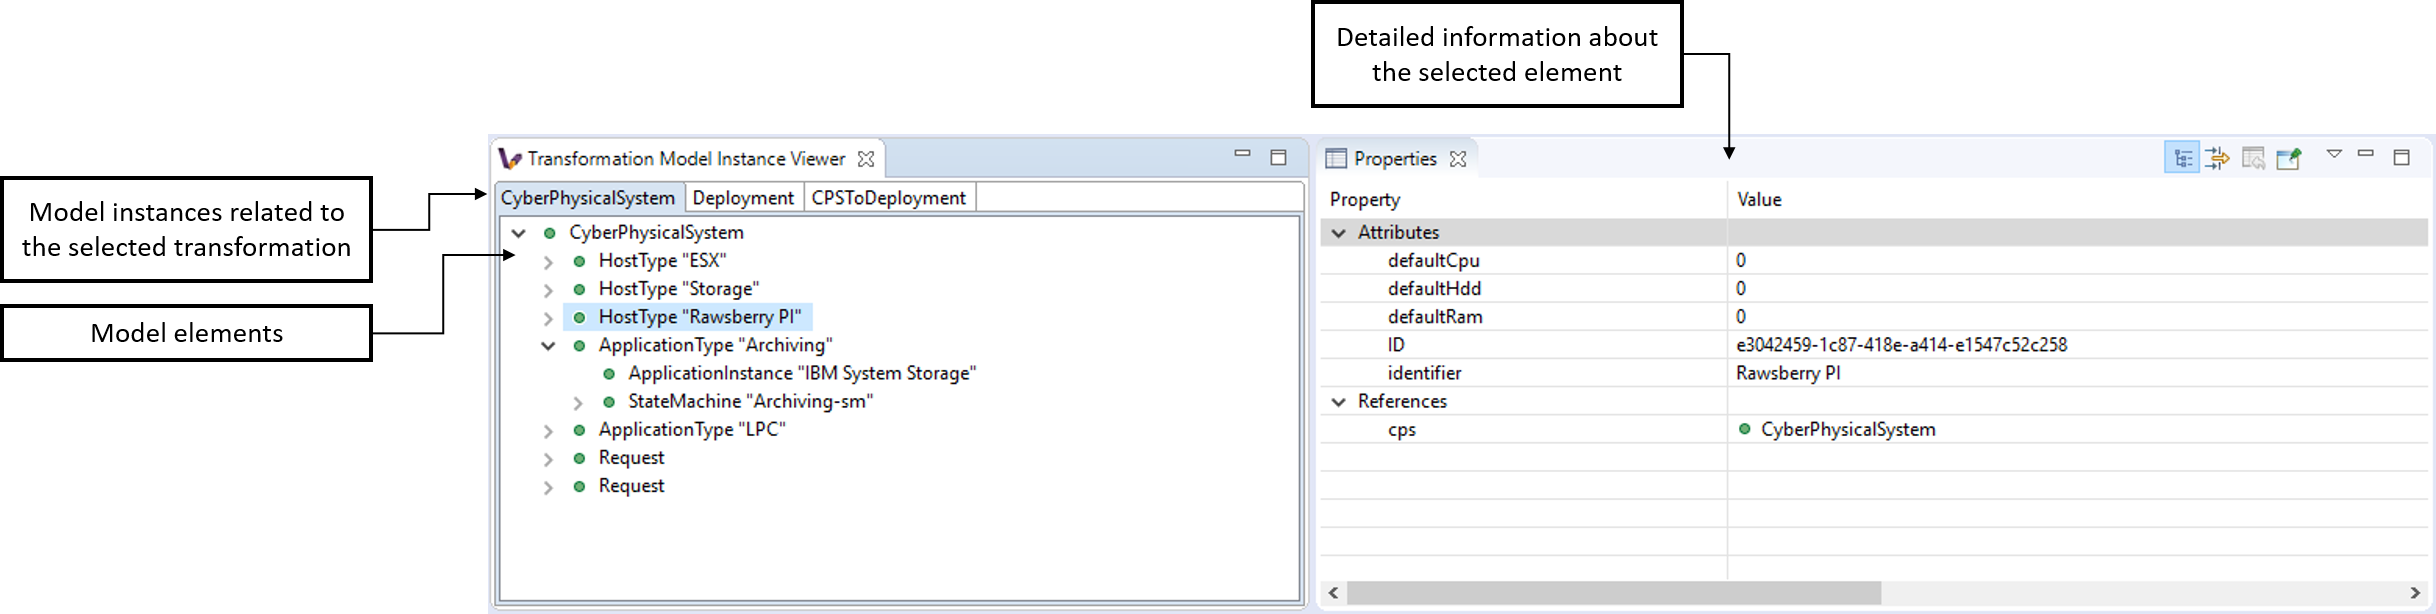
The Transformation Model Instance Viewer enables the transformation developer to observe the state of the source and target model instances related to the model transformation selected in the Adaptable Transformation Browser view. This view displays the model instances in a multi-tabbed tree view with properties view support.
The parameters of the next activation to be executed can be observed via the Variables Eclipse Debug View. After selecting the given debug stack frame (representing a transformation rule activation), the parameters of the transformation rule precondition are displayed as variables.
4.3.2.3. Controlling the transformation execution sequence
The VIATRA transformation debugger enables the transformation developer to control the execution sequence of the transformation under debugging. This can be done in the following ways.
Using Breakpoints and standard debug commands
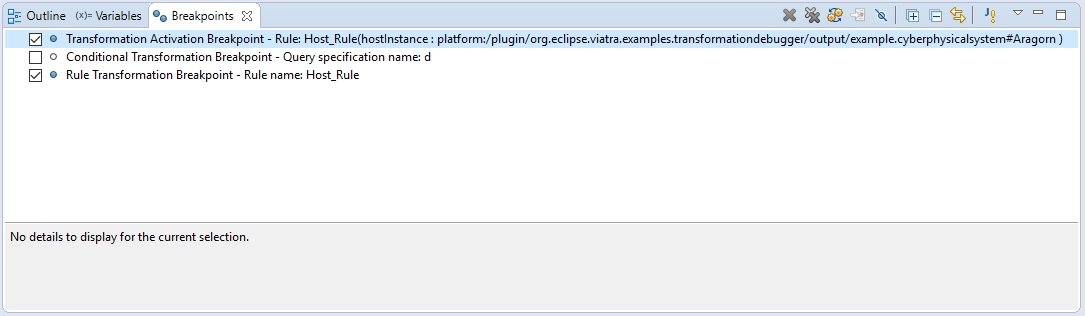
The Transformation debugger supports the following breakpoints:
-
Activation breakpoint: Activation breakpoints can be toggled via selecting a rule activation and using the appropriate command on the Transformation Browser view.
-
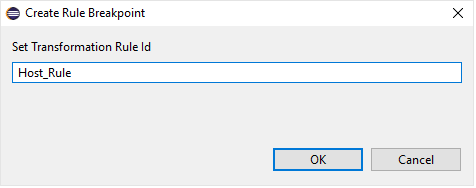
Rule Breakpoint: Rule breakpoints can be created via selecting a model transformation instance and using the appropriate UI element. Once this is done, the following dialog opens, on which the transformation developer can specify the name of the transformation rule. Once an activation is about to be executed, the debugger checks if the activation derives from the rule associated with the specified name. If this condition is true, the execution is halted.
-
Conditional breakpoint: These breakpoints allow the user to define VIATRA Query based conditions to halt the execution of the transformation. In order to create a conditional breakpoint, select a model transformation instance in the Transformation Browser view, and use the appropriate command on the view’s command bar. Afterwards, a dialog window opens which allows the user to define VIATRA query patterns. The execution of the transformation is halted once the match set of the pattern changes.
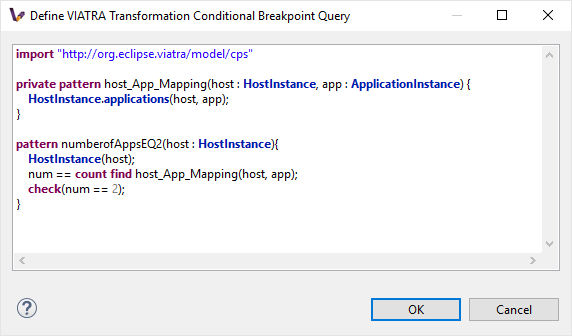
| This editor reuses the standard Xtext based VIATRA query editor, however in this case, package definitions should be omitted (as there is no enclosed Eclipse resource to the file). Furthermore, the definition can contain only one public pattern at this point, this restriction, however, does not apply to private patterns. |
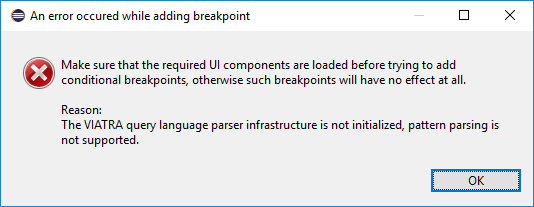
| The Debugger runtime component reuses the VIATRA Query language parser infrastructure to parse the patterns contained in conditional breakpoints. The debugger runtime component explicitly does not require classes of the parser infrastructure to be loaded (in order to minimize the dependencies of said runtime component). Make sure however, if conditional breakpoints are used, the target platform on which the transformation under debugging is running should contain the VIATRA Query Tooling UI elements, and they should be initialized as well. If these required steps are omitted, the debugger produces the following error message: |
| The rule and conditional breakpoints are persisted between individual transformation debugging sessions. The breakpoints are contained in a common breakpoint pool managed by the Eclipse Breakpoint Manager. |
| The breakpoints added are displayed in the Breakpoints Eclipse Debug view. Which can be used to disable and remove these breakpoints. |
Supported Eclipse debug commands: * Step Over (F6): If the transformation execution is halted, use this command the execute the next activation, and stop the execution again. * Resume (F8): If the transformation execution is halted, use this command to continue the execution of the transformation until a breakpoint is hit. * Terminate (Ctrl+F2): The transformation is resumed and the debugger agent is disconnected from the target transformation. The transformation debugging session is terminated.
Unsupported Eclipse debug commands (These features are not implemented yet): * Step Return * Step Into * Suspend * Disconnect
Directly selecting the next transformation activation to be fired
The transformation debugger allows the user to define which activation should be executed next. In order to do this, select an activation and use the appropriate command to set it as the next activation to be executed.
| The changes made this ways could produce unpredictable behavior in the model transformation (Overriding the defined priority could result in inconsistent model states). Use this feature cautiously. |
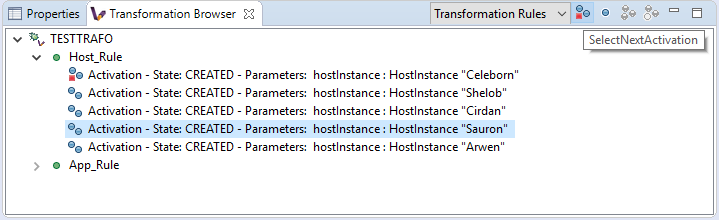
Once the next activation is selected, notice that the red rectangle representing, the next activation to be fired, is moved to the desired activation. At this point, if the transformation is resumed, it will continue its execution from the selected activation.
4.3.3. Corner cases
4.3.3.1. Trying to connect to an unreachable VIATRA transformation instance
If the VIATRA transformation instance specified in the debugger launch configuration does not exist, the debugger tooling will inform the user, that the debugging session could not be initialized and terminate the newly created session as well.
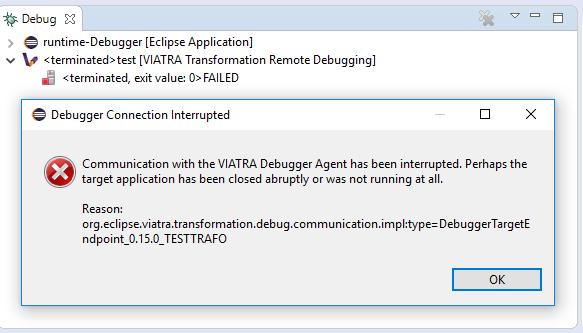
4.3.3.2. Transformation under debugging terminated abruptly.
If the eclipse instance in which the target transformation is running is terminated, or the connection is severed between the host and target components, the debugger tooling will terminate the respective VIATRA debugger launch automatically.
4.3.3.3. Trying to add a conditional breakpoint, but the Xtext parser infrastructure is not initialized.
In order to ensure that the conditional breakpoint patterns are parsed properly in the runtime Eclipse instance, the Xtext parser infrastructure needs to be initialized. If the debugger tooling produces the following exception, open a VIATRA query view (e.g.: VIATRA Query Explorer) to manually initialize the parser tooling. These manual steps are needed, as Xtext-based parser tooling components are loaded lazily.
| Once Discovered, additional corner cases will be added. |
5. VIATRA EVM Barebone
5.1. Preparation of the transformation
A ViatraQueryEngine is needed over an EMFScope. This EMFScope contains the resource set in which the source and the target of the transformation can be found. The main part of the demo is in the execute method.
5.2. Transformation rules
We have two main rule: the hostMapping and appMapping.
The hostMapping has three job (one for all states of the life cycle):
-
The pattern: This rule is based on the hostInstances pattern. This pattern finds all host instances.
-
ActivationState.CREATED: This job create deployment hosts for host instances. The ip of the deployment host is set here.
-
ActivationState.DELETED: This removes deployment pairs of disappeared host instances.
-
ActivationState.UPDATED: This will be invoked when the hostInstances pattern updated (so when a host type or host instance is modified). The description of the deployment host is set to
modified.
-
The appMapping has only two job:
-
The pattern: This rule is based on the applicationsInstances pattern. This finds application instances which is allocated to host instance which has a pair in the deployment.
-
ActivationState.CREATED: Creates the deployment application (sets the id).
-
ActivationState.DELETED: Removes the deployment application.
-
5.3. Resolver
There is an InvertedDisappearancePriorityConflictResolver which can be used to order activations.
5.4. Execution versions
5.4.1. Execution Schema
This is the simple way of the execution. For this you need to set the simple field to true (at the top of the class).
A scheduler factory is created for the ViatraQueryEngine and an execution schema is created based on this factory and the ViatraQueryEngine. After these steps the conflict resolver is set and rules are added to the schema. The execution is triggered by the startUnscheduledExecution method.
Code:
// Create schema
val schedulerFactory = Schedulers.getQueryEngineSchedulerFactory(engine)
val schema = ExecutionSchemas.createViatraQueryExecutionSchema(engine, schedulerFactory)
// Setup conflict resolver
schema.conflictResolver = resolver
// Add rules to the schema
schema.addRule(hostMapping)
schema.addRule(appMapping)

schema.startUnscheduledExecution
5.4.2. Advanced executions
Here are the versions of manual executions of activations. For these the value of the simple field should be false.
5.4.2.1. Common parts
For all advanced version of execution need a rule engine (based on the ViatraQueryEngine), a context, and the setup of these elements (conflict resolver and addition of rules for the rule engine).
Code:
// Create rule engine over ViatraQueryEngine
val ruleEngine = RuleEngines.createViatraQueryRuleEngine(engine)
// Create context for execution
val context = Context.create()
// Conflict resolver also can be used here
ruleEngine.conflictResolver = resolver
// Add rule specifications to engine
ruleEngine.addRule(hostMapping)
ruleEngine.addRule(appMapping)
5.4.2.2. Fire one activation of a specific rule
Activations of a rule can be queried from the rule engine. This is a set which can be iterated and the activation can be fired (with the context) so we can fire the first one.
Code:
// Check rule applicability
val createClassesActivations = ruleEngine.getActivations(hostMapping)
if (!createClassesActivations.empty) {
    // Fire activation of a given rule
    createClassesActivations.iterator.next.fire(context)
}
5.4.2.3. Fire all activations
Next activation from the rule engine is fired while the set of conflicting activations is not empty so we can fire all activations. After firing all activations rules are removed from the rule engine.
Code:
// Check for any applicable rules
while (!ruleEngine.conflictingActivations.empty) {
    // Fire next activation as long as possible
    ruleEngine.nextActivation?.fire(context)
}
// Remove rules after execution
ruleEngine.removeRule(appMapping)
ruleEngine.removeRule(hostMapping)
5.4.2.4. Filter activations
First of all a custom event filter is created. This filter works over HostInctanceMatch objects and filter out match which contains host instance with the specified nodeIp. The rule should be added to the rule engine with the filter (if we want that the unfiltered rule does not cause a problem it should be removed) and after this we can iterate over the activations just like in the previous version (but only one deployment host will be created if the original rule has been removed).
Code:
// Create custom filter for IP
var eventFilter = new EventFilter<HostInstancesMatch>() {
	override isProcessable(HostInstancesMatch eventAtom) {
		eventAtom.hostInstance.nodeIp == FILTERED_IP
	}
}
// Replace the simple rule with the rule->filter pair in the engine
ruleEngine.removeRule(hostMapping)
ruleEngine.addRule(hostMapping, eventFilter)
// Fire all activations
while (!ruleEngine.conflictingActivations.empty) {
    // Fire next activation as long as possible
    val nextActivation = ruleEngine.nextActivation
    nextActivation?.fire(context)
}
5.4.2.5. Manage conflict set manually
At this version a different filter is created: a ViatraQueryMatchEventFilter which works with a specific match. This match is created for a host instance. We need to add the hostMapping-filter pair to the rule engine. The removal of the original rule is not necessary.
Code for filter:
// Create query match filter with a partial match object
val matchFilter = ViatraQueryMatchEventFilter.createFilter(
	HostInstancesMatch.newMatch(
		engine.hostInstancesByIp.getOneArbitraryMatch(null, FILTERED_IP).hostInstance
	)
)
// Add the rule->filter pair to the engine
ruleEngine.addRule(hostMapping, matchFilter)
The main part of this section is the next: a scoped conflict set is created from the rule engine. It expects a resolver and a multi map of rules and filters. Because of this last point the original rule does not need to be removed from the rule engine. Important that the simple rule addition uses empty filter (and not a null value) when registers the rule so at the map empty filter should be used for these rules. The nextActivation method of this conflict set gives the next activation which can be fired (if no activation can be fired the return value will be null so a null check is necessary before the fire).
Code for conflict set:
// Check that there is any conflicting activation
if(!ruleEngine.conflictingActivations.empty) {
	// Create the conflict set
	val conflictSet = ruleEngine.createScopedConflictSet(resolver,
		// From filtered hostMapping rule and unfiltered appMapping
		ImmutableMultimap.of(
			hostMapping, matchFilter,
			appMapping, appMapping.createEmptyFilter
		)
	)
	// Iterate over activations of the conflict set
	var nextActivation = conflictSet.nextActivation
	while(nextActivation != null) {
		nextActivation.fire(context)
		nextActivation = conflictSet.nextActivation
	}
}
6. Using Queries Programmatically
6.1. Managed Engine
-
Create an instance of ExampleQueries
-
Create the EMFScope for the resource (or resourceSet)
-
Use
AdvancedViatraQueryEngine.onfor creation of the managed engine -
Prepare the engine
-
Usage of the
hostInstancesForIPpattern-
Get HostInstance of the only one match from the matcher for the fixed IP parameter in one line
-
-
Usage of the
hostTypesConnectedToApplicationTypespattern-
Use forEachMatch and the generated match processor for iterating all matches.
-
Code:
extension val exampleQueries = ExampleQueries.instance

val scope = new EMFScope(resource)
val engine = AdvancedViatraQueryEngine.on(scope)
engine.prepare

val searchedHost = engine.hostInstancesForIP
                            .getOneArbitraryMatch(null, SEARCHED_IP)
                            .hostInstance

engine.hostTypesConnectedToApplicationTypes.forEachMatch(new HostTypesConnectedToApplicationTypesProcessor() {
    override process(HostType pHostType, ApplicationType pAppType) {
        '''«pHostType.identifier»«IF pHostType.identifier.length<8»	«ENDIF»	| «pAppType.identifier»'''.log
    }
})
6.2. Unmanaged Engine
-
Create an instance of ExampleQueries
-
Create the EMFScope for the resource (or resourceSet)
-
Use
AdvancedViatraQueryEngine.createUnmanagedEnginefor creation of the unmanaged engine -
Usage of the
hostInstancesForIPpattern-
Get matcher from instance of queries (this needs an engine)
-
Get the only one match from the matcher for the fixed IP parameter
-
Get the HostInstance of the match
-
-
Usage of the
hostTypesConnectedToApplicationTypespattern-
Get all matches in a one line expression (thanks for Xtend extension)
-
Pretty print use the default forEach of Xtend for iterating matches
-
-
Dispose the engine
Code:
extension val exampleQueries = ExampleQueries.instance

val scope = new EMFScope(resource)
val engine = AdvancedViatraQueryEngine.createUnmanagedEngine(scope)

val hostInstancesMatcher = exampleQueries.getHostInstancesForIP(engine)
val hostInstanceMatch =
        hostInstancesMatcher.getOneArbitraryMatch(null, SEARCHED_IP)
val searchedHost = hostInstanceMatch.hostInstance

val hostTypesConnectedToApplicationTypesMatches =
        engine.hostTypesConnectedToApplicationTypes.allMatches
hostTypesConnectedToApplicationTypesMatches.prettyPrintMatches

engine.dispose
6.3. Unmanaged Engine with Local Search
-
Create an instance of ExampleQueries
-
Create the EMFScope for the resource (or resourceSet)
-
Use
AdvancedViatraQueryEngine.createUnmanagedEnginefor creation of the unmanaged engine -
Create a query evaluation hint for LocalSearchBackend (
USE_BASE_INDEXis false) -
Usage of the
hostInstancesForIPpattern-
Get matcher from the engine for the pattern and the hint
-
Get the host instance of the only match from the matcher for the partial match
-
-
Usage of the
hostTypesConnectedToApplicationTypespattern-
Get matcher from the engine for the pattern and the hint and get all values of host types
-
Print host types
-
-
Dispose the engine
Code:
extension val exampleQueries = ExampleQueries.instance
val scope = new EMFScope(resource)
val engine = AdvancedViatraQueryEngine.createUnmanagedEngine(scope)
val hint = new QueryEvaluationHint(
                LocalSearchBackendFactory.INSTANCE,
                #{LocalSearchHintKeys.USE_BASE_INDEX -> false}
)

val hostInstancesForIPMatcher = engine.getMatcher(hostInstancesForIP, hint)
val searchedHost =
        hostInstancesForIPMatcher
            .getOneArbitraryMatch(
                HostInstancesForIPMatch.newMatch(null, SEARCHED_IP))
            .hostInstance

val hostTypesConnectedToApplicationTypesMatches =
        engine.getMatcher(hostTypesConnectedToApplicationTypes, hint)
            .allValuesOfhostType
'''HostTypes:'''.log
hostTypesConnectedToApplicationTypes.forEach['''	«it.identifier»'''.log]

engine.dispose
7. Displaying Query Results in the User Interface
As far as the visualization of VIATRA pattern matching results is concerned, the VIATRA framework provides two approaches:
-
VIATRA Data Binding Addon: Using this addon, VIATRA pattern matches can be directly incorporated in newly developed applications that utilize JFace Data Binding.
-
VIATRA Viewers Addon: The VIATRA Viewers component helps developing model-driven user interfaces by filling and updating model viewer results with the results of model queries. The implementation relies on (and is modeled after) the Event-driven Virtual Machine and JFace Viewers libraries.
7.1. VIATRA Data Binding
VIATRA provides a simple data binding facility that can be used to bind pattern matches to UI elements. The feature is mainly intended to be used to integrate VIATRA queries to newly developed user interfaces. In order to utilize this functionality, the source patterns need to be annotated, and the used UI components need to be bound to the Observables provided by the data binding API. In the following sections an example is shown which uses VIATRA Data Binding.
7.1.1. Required annotations
-
@ObservableValue: allows the developer to customize the appearance of a match. It defines an observable value (as defined in JFace Data Binding) which can be bound to an Eclipse/JFace UI.
-
name (String): the name of the parameter
-
expression (String): the attribute to be observed definition without '$' marks. For example
@ObservableValue(name = "id", expression = "host.identifier") -
labelExpression: this annotation makes it possible to create observable string properties, which are useful when presenting relations between objects inside a JFace viewer component.
-
@ObservableValue(name = "id", expression = "host.identifier")
@ObservableValue(name = "node_ip", expression = "host.nodeIp")
@ObservableValue(name = "current_cpu", expression = "host.availableCpu")
@ObservableValue(name = "current_hdd", expression = "host.availableHdd")
@ObservableValue(name = "current_ram", expression = "host.availableRam")
@ObservableValue(name = "total_cpu", expression = "host.totalCpu")
@ObservableValue(name = "total_hdd", expression = "host.totalHdd")
@ObservableValue(name = "total_ram", expression = "host.totalRam")
pattern hostInstances(host: HostInstance) {
	HostInstance(host);
}

@ObservableValue(name = "id", expression = "app.identifier")
@ObservableValue(name = "state", expression = "app.state")
@ObservableValue(name = "db_user", expression = "app.dbUser")
@ObservableValue(name = "db_pass", expression = "app.dbPassword")
@ObservableValue(name = "allocatedTo", expression = "app.allocatedTo")
pattern applicationInstances(app: ApplicationInstance) {
	ApplicationInstance(app);
}
7.1.2. Using data binding to populate a table
//Initialize VIATRA query engine
ViatraQueryEngine engine = ViatraQueryEngine.on(new EMFScope(resourceSet));
//Get the matcher for the query to be observed (HostInstances pattern)
HostInstancesMatcher matcher = HostInstancesMatcher.on(engine);
//Create a generic data binding adapter for the query specification
//It is responsible for creating observable value properties based on the annotations of the pattern
GenericDatabindingAdapter adapter = new GenericDatabindingAdapter(HostInstancesMatcher.querySpecification());
//Bind the matches to the given TableViewer
ViewerSupport.bind(
	tableViewer,
	//Get the matching results as an observable list
        ViatraObservables.observeMatchesAsList(matcher),
        //Specify observed proeprties
        new IValueProperty[] {
		adapter.getProperty("id"),
		adapter.getProperty("node_ip"),
		adapter.getProperty("current_cpu"),
		adapter.getProperty("current_hdd"),
		adapter.getProperty("current_ram"),
		adapter.getProperty("total_cpu"),
		adapter.getProperty("total_hdd"),
		adapter.getProperty("total_ram") });
7.1.3. Master - detail data binding with a list
The following code fragment is responsible for binding a list to the results of a VIATRA query, and also displays match details in text boxes. (Uses Master-detail binding)
//Create new data binding context
//It will be used for binding the pattern match details
DataBindingContext dataBindingContext = new DataBindingContext();
//Initialize VIATRA query engine
ViatraQueryEngine engine = ViatraQueryEngine.on(new EMFScope(resourceSet));
//Get the matcher for the query to be observed (ApplicationInstances pattern)
ApplicationInstancesMatcher matcher = ApplicationInstancesMatcher.on(engine);
//Create a generic data binding adapter for the query specification
//It is responsible for creating observable value properties based on the annotations of the pattern
GenericDatabindingAdapter adapter = new GenericDatabindingAdapter(ApplicationInstancesMatcher.querySpecification());
//Bind the matches to the given ListViewer
ViewerSupport.bind(listViewer, ViatraObservables.observeMatchesAsSet(matcher), adapter.getProperty("id"));

//At this point, the results of the given pattern will appear in the list Viewer, the details however still need to be implemented
//Define target observable values for both textboxes
IObservableValue dbUserTarget = WidgetProperties.text().observe(dbUser);
IObservableValue dbPassTarget = WidgetProperties.text().observe(dbPass);

//Observe the changes in the list selection
IViewerObservableValue listSelection = ViewerProperties
	.singleSelection().observe(listViewer);

//Use the data binding context to bind the text property of the target textbox and the given property of the matcher.
dataBindingContext.bindValue(
	//Target textbox observable value
	dbPassTarget,
	//Get the source observable value from the adapter
	adapter.getProperty("db_pass").observeDetail(listSelection),
	//Define EMF update value strategy
	//In this case its one directional
	new EMFUpdateValueStrategy(UpdateValueStrategy.POLICY_NEVER),
	new EMFUpdateValueStrategy());

dataBindingContext.bindValue(dbUserTarget, adapter.getProperty("db_user").observeDetail(listSelection),
	new EMFUpdateValueStrategy(UpdateValueStrategy.POLICY_NEVER),
	new EMFUpdateValueStrategy());
7.2. VIATRA Viewers
The VIATRA Viewers component can bind the results of queries to various JFace Viewers: JFace ListViewer and TreeViewers are currently supported. Additionally, by installing extra features from the extra update site GraphViewers (based on GEF4 Zest) are also supported. In the following example, and during the lab excersize as well, usage of GraphViewers will be presented. These GraphViewers are capable of displaying query results as graphs.
7.2.1. Usage
In order to use the VIATRA Viewers addon the following steps need to be undertaken:
-
Annotate VIATRA query patterns with the @Item, @ContainsItem and @Edge annotations
-
@Item will be represented as a graph node
-
@ContainsItem will be represented as a node and an edge (edge is between the parent and child nodes)
-
@Edge will be displayed as an edge (targeted)
-
-
Initialize the Viewers based UI component
7.2.2. Pattern Annotations
//Host Type objects will be nodes of the displayed graph
@Item(item = host, label = "$host.identifier$")
//Format options can be set using the @Format annotation
@Format(color = "#0033CC", textColor = "#FFFFFF")
pattern hostTypes(host) {
	HostType(host);
}
//Host types contain host instances
//Displayed as nodes which have common edges with their parents
@ContainsItem(container = type, item = instance)
pattern connectTypesAndInstancesHost(type, instance) {
	HostType.instances(type,instance);
}
//Host instances can communicate with each other
//Displayed as an edge between the two nodes
@Edge(source = i1, target = i2, label = "comm")
pattern communications(i1, i2) {
	HostInstance.communicateWith(i1,i2);
}
7.2.3. Example initialization
//Create the graph viewer component and add it to the containing SWT control
GraphViewer viewer = new GraphViewer(parent, SWT.None);
//Create a new Viewer state based on the created VIATRA query engine and a set of annotated VIATRA query specifications
ViewerState state = ViatraViewerDataModel.newViewerState(getEngine(), getSpecifications(), ViewerDataFilter.UNFILTERED,
		ImmutableSet.of(ViewerStateFeature.EDGE, ViewerStateFeature.CONTAINMENT));
//This method of binding supports isolated nodes
ViatraGraphViewers.bindWithIsolatedNodes(viewer, state, true);
//Define layout algorithm
viewer.setLayoutAlgorithm(new SpaceTreeLayoutAlgorithm());
//Apply layout
viewer.applyLayout();